
Card sorting and tree testing are low-cost methods that put real audience data behind your site architecture decisions — replacing internal opinions with visitor insights.
Designing a website for a nonprofit often leads to a classic case of “too many cooks in the kitchen.” Every program, department, or team has strong ideas about the necessary ingredients for the site — what goes on the homepage, which visuals to use, how to structure the navigation. Frequently, many of those strong opinions conflict with each other, leading to deadlock.
This too-many-cooks approach usually misses one critical perspective: the audience.
Rather than engage in endless debates about restructuring this section or that, let your audience help find the right approach. Gathering data from your site visitors through user experience (UX) tests is a great way to break through the deadlock and resolve thorny questions.
This article is the second in a series looking at UX testing for nonprofit websites. We’ll explore two practical methods for defining a user-friendly information architecture for your site: card sorting and tree testing.
The former works best when you’ve got a bunch of topics but aren’t sure how best to organize and label them. The latter is ideal when you have a navigational structure in mind that you’d like to test with real people from your audience.
Both of these tests are reasonably low effort, yet deliver high return on investment. Let’s get started.
Card sorting
The card sorting research method helps you understand how your audience members think about the content of your website. How would they categorize and organize topics? What terms would they use?
To do a card sorting activity, you’ll need to recruit some people in your audience to participate. Ideally, you will get participants from each of your audience segments. You can do the test in person with index cards or virtually using platforms such as Optimal Workshop. These days, online tools make this work a lot easier, as you can reach more people, work asynchronously, and collect data that the tool automatically analyzes.
The test involves the following steps:
- Compile a list of topics, pages, or other content in your website. Gather all the ideas from your various contributors to the site planning process — a braindump of 30 to 50 ideas will work well. You can also pull ideas from user journey maps, if you’ve created those. (See the first article in this series for more detail)
- Create a series of cards with those topics, etc. If you’re using note cards, write one topic per card. If you’re using an online tool like Optimal Workshop, copy and paste the topics into cards and follow the prompts.
- Recruit participants. Ideally, you will get 30 or more people from your audience to participate. You can recruit participants from your email list, social media followers, or even board members and volunteers. The test usually only takes 10 minutes or so, and can actually be a fun and novel activity for them. If you can’t get that many people to participate, you can still uncover useful patterns from 10-15 participants. The data will be less statistically robust, but you’ll get insights that beat guessing.
- Ask participants to organize the cards into groups. Don’t provide much guidance here — the main idea is to let them organize the topics in any way that makes sense to them.
- Ask them to write a label for each group. How would they describe the cards in each group? What term best describes each group? Likewise, leave it entirely up to them to create the category labels.
Once you have results from all participants, look for the patterns and commonalities. Online tools like Optimal Workshop’s card sort do a lot of this work for you. In any case, you’ll get some insights into how your audience members would look for information.
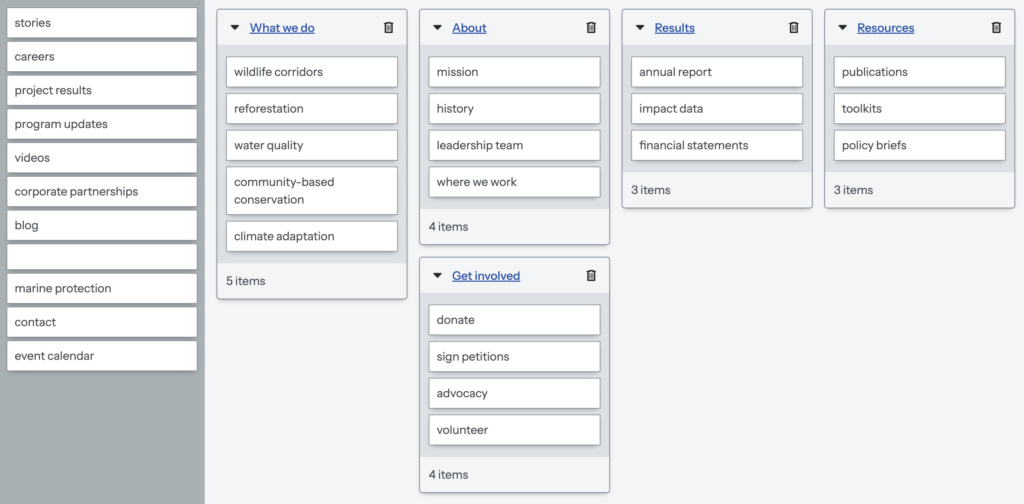
For example, you might discover that your audience tends to place “annual report,” “impact data,” and “financials” under a label like “Results” — not under “About Us” or “Resources”’ where your current website has placed them.
Here’s what a card sorting activity might look like in practice, with an example of an environmental nonprofit:
With the insights from this activity, you can create an information architecture that you can test out — where tree testing can be very helpful.
Tree testing
Whereas card sorting seeks to generate audience-centered ideas for your information architecture, tree testing aims to see which ideas actually work well. In a tree test, you start with a well-defined website navigation and then ask test participants to complete various tasks. You’ll assess how easily they can find information, and how quickly they do it.
While in theory you might be able to do this test in person, tree testing works best in a virtual setting, using Optimal Workshop or a similar platform. The test can typically be completed by participants in 10 minutes or less and can be distributed to as many people as you care to invite.
Here’s how it works:
- Define the website architecture you’d like to test. The navigation structure should have maybe four or five top-level pages, several subpages, and potentially third-level subpages as well.
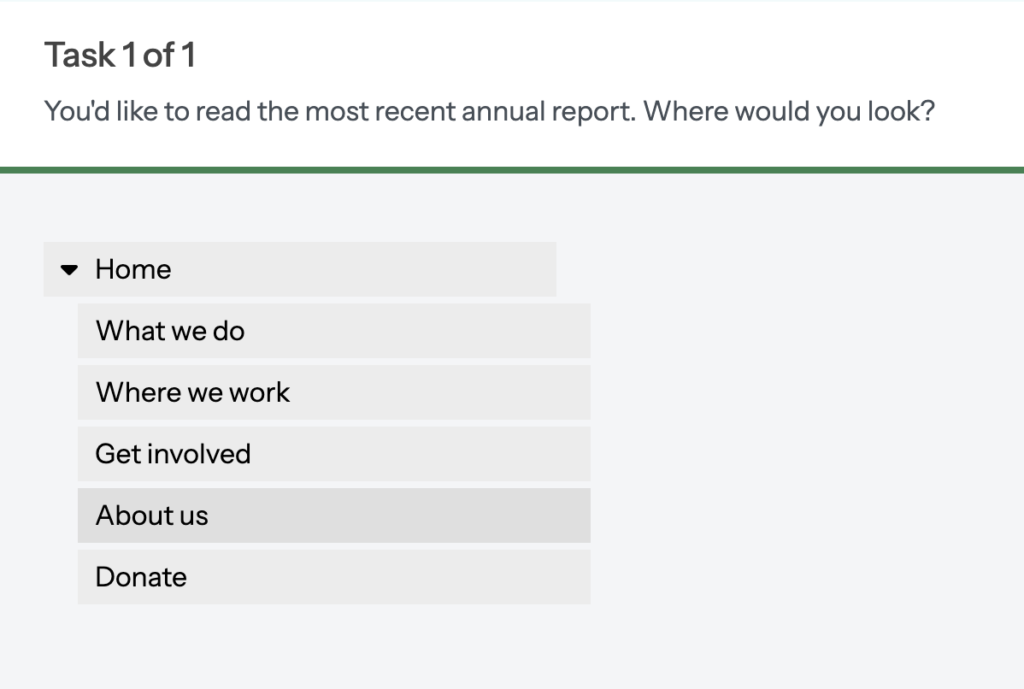
- Create some tasks representing common audience goals on your website. These tasks tie directly to the user journeys you might have already created by this point. For example, a task might be “You are looking for a way to donate to XYZ organization. Where would you look to do this?”
- Specify the correct answers for each task. This would be one or more paths through the website architecture where visitors can complete each task, such as finding a specific webpage.
- Recruit participants. Like the card sorting, you’ll get the best results if you have at least 30 participants. Likewise, it’s a quick and interesting activity, so is a small ask. And like card sorting. Even a handful of peopl
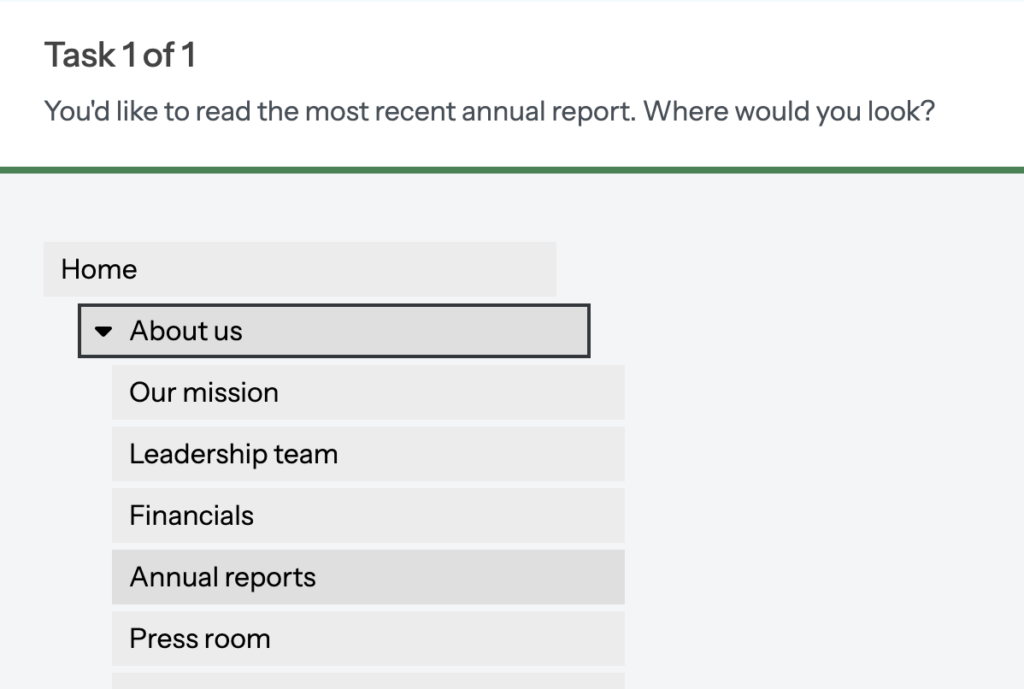
- Distribute the test and assess the results. Once you have a critical mass of participants complete the test, you’ll see some patterns emerge. Which tasks did they struggle with most frequently? What is the ratio of task success to failure? How many times did they go backward and forward in the navigation looking for the right location?
As an example of what you might uncover, you might find that 60% of participants required three or more clicks to locate your volunteer sign-up — a clear signal that it needs a more intuitive place in the navigation.
Here’s what a tree test might look like:
Putting it all together
If you have the budget and a reasonable timeline, you could do both of these tests. In an ideal world, you can run at least one card sort, and two rounds of tree testing. But if you need to prioritize, either test has a slightly different value and use case.
Card sorting is typically better when you have more ambiguity about how to organize your content. It will give you ideas for specific terms that people use to mentally organize your content. That can help you come up with the right labels for your navigation. If you can only do one test, this is probably the better option. It will reveal how your audience thinks, rather than how your organization thinks.
Tree testing is more useful when you feel reasonably confident about your navigation structure — but you want to put it to the test. It will then show you how easy it is for people to complete specific tasks. With the data from the first round, make some changes to the navigation, and test it out again.
These tests also work well in combination with other UX design activities. With journey maps (Part 1 in this article series) showing you what your audience needs to do, and card sorting and tree testing showing you where they’d look to do it, you have the foundation for a site architecture that works.
However you slice it, with a modest investment of time, you’ll have data to show the various cooks which terminology and structure your site visitors actually prefer.
Try it out, and let me know how it goes! If you need support, feel free to reach out: